Fix D2C Unit Economics: How to Increase LTV & Cut CAC in India
Most ₹2–20 Cr D2C brands in India don't have a growth problem.
They have a unit economics problem.
CAC is rising.
Repeat purchase rate is flat.
Contribution margin is shrinking.
And the LTV:CAC ratio never crosses 2:1.
You might be searching for ways to reduce CAC for D2C in India or looking for strategies to increase Customer Lifetime Value (CLTV).
But the answer isn't "better ad creatives."
It is smart segmentation combined with intelligent engagement.
Why D2C Unit Economics Break (The Math)
Let's look at the P&L of a typical scaling brand.
Average Order Value (AOV): ₹1,200
Gross Margin (65%): ₹780
Logistics (Shipping + COD + RTO): -₹180
Discount (10%): -₹120
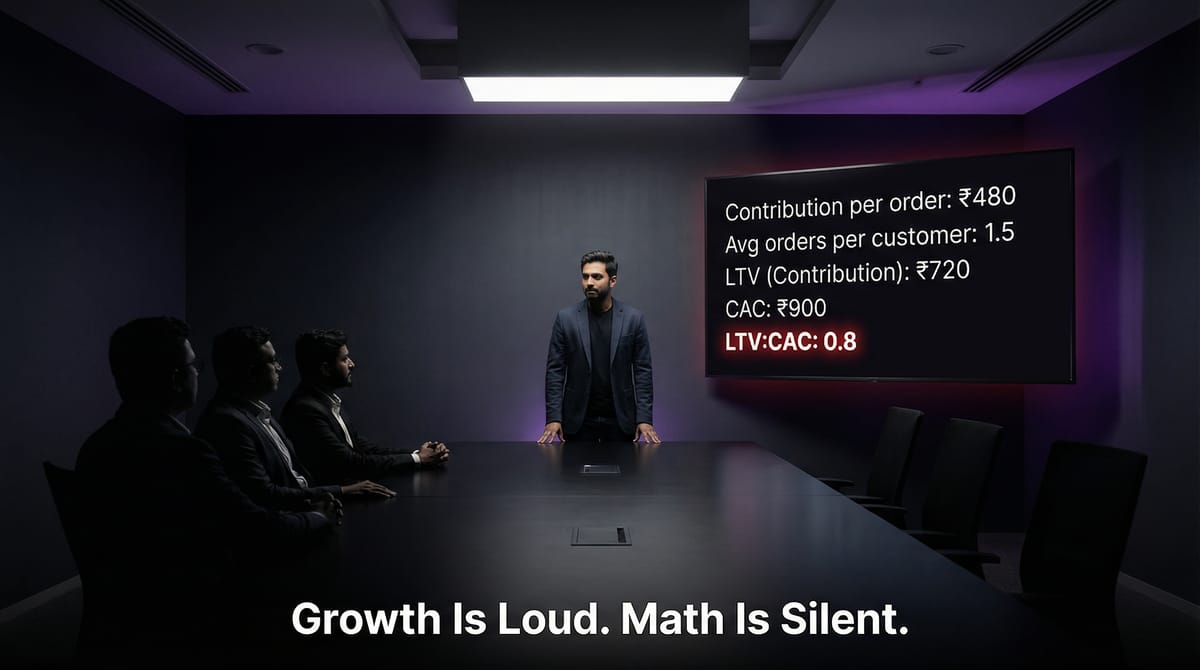
Contribution Margin: ₹480
If your Customer Acquisition Cost (CAC) is ₹900, you are losing -₹420 on every new customer.
If customers average 1.5 orders per customer:
LTV: ≈ ₹720
LTV:CAC: 0.8
You are not scaling a business; you are scaling losses.
This is why most D2C brands in India plateau at the ₹5Cr – ₹20Cr mark.
| THE UNIT ECONOMICS DEATH SPIRAL | |||
| Purchase Frequency | LTV Calculation | LTV:CAC Ratio | Status |
|---|---|---|---|
| 1.5 purchases | ₹480 × 1.5 = ₹720 | 0.8 | ❌ UNPROFITABLE |
| 3 purchases | ₹480 × 3 = ₹1,440 | 1.6 | ⚠️ BARELY VIABLE |
| 5 purchases | ₹480 × 5 = ₹2,400 | 2.67 | ✅ PROFITABLE & SCALABLE |
| 👉 The difference is REPEAT RATE | |||
💡 What is a good LTV:CAC ratio for a D2C brand?
For sustainable scaling, most D2C brands should aim for an LTV:CAC ratio of at least 3:1.
A ratio below 2:1 usually indicates fragile unit economics where rising acquisition costs can quickly erode profitability. A strong ratio allows brands to reinvest confidently in growth while maintaining healthy contribution margins.
The Real Lever: Increase Repeat Purchase Rate
To fix this, stop obsessing over "Growth."
Start engineering "Retention."
You need to:
- ✅ Increase repeat purchase frequency
- ✅ Increase Average Order Value (AOV)
- ✅ Reduce effective CAC (by amortizing it over more orders)
This doesn't happen by accident. It happens through behavioral segmentation.
💡 What is a healthy repeat purchase rate for D2C brands in India?
For most D2C brands in India, a healthy repeat purchase rate typically ranges between 25–30%.
If your repeat rate is below 20%, you are likely over-reliant on paid acquisition. Structured retention systems can meaningfully improve this over time depending on product category and usage cycle.
Increasing repeat purchase rate is not about sending more campaigns. It requires structured segmentation, precision timing, and habit-building engagement.
| HOW REPEAT RATE TRANSFORMS PROFITABILITY | |||||
| Scenario | Customer Split | Total Orders | Contribution | Profit/Loss | Result |
|---|---|---|---|---|---|
| A: 20% Repeat | 800 buy once 200 buy twice |
1,200 | ₹5,76,000 | -₹3,24,000 | ❌ LOSING ₹324/customer |
| B: 40% Repeat (+20 points) |
600 buy once 400 buy 3x avg |
1,800 | ₹8,64,000 | -₹36,000 | ⚠️ NEAR BREAKEVEN |
| C: 50% Repeat (+30 points) |
500 buy once 500 buy 4x avg |
2,500 | ₹12,00,000 | +₹3,00,000 | ✅ PROFITABLE ₹300/customer |
|
30-point improvement = ₹6,24,000 swing 👉 THIS IS WHY RETENTION IS EVERYTHING |
|||||
Note: All scenarios assume 1,000 customers acquired at ₹900 CAC each (₹9,00,000 total spend)
Step 1: Use RFM Analysis (Stop Just "Filtering")
Basic segmentation (New vs. Lapsed) is lazy.
To win in 2026, use the RFM analysis model:
- Recency: When did they last purchase?
- Frequency: How often do they buy?
- Monetary: How much do they spend?
This allows you to identify:
- 🐋 Whales: High-value loyalists
- 💸 Discount Junkies: Only buy on sale (do not over-invest here)
- 🎯 One-Hit Wonders: Need distinct activation
- 📈 Category Expanders: Buy facewash but not moisturizer
This is the foundation of a real retention marketing strategy.
| RFM SEGMENTATION MATRIX | ||||
| Segment | Frequency | Monetary Value | Recency | Action Strategy |
|---|---|---|---|---|
| 🐋 WHALES | High | High | Recent | VIP treatment, early access, concierge service |
| 💎 VIPs | Low | High | Recent | Increase frequency, cross-sell opportunities |
| 📈 LOYALISTS | High | Medium | Recent | Upsell, loyalty rewards, referral programs |
| 🎯 POTENTIALS | Low | Medium | Recent | AOV increase, usage education, habit building |
| 💸 DISCOUNT JUNKIES | Variable | Low | Recent | Limit discounts, exclude from high bids |
| 😴 AT RISK | Low | Medium | Lapsed | Win-back campaigns, re-engagement, surveys |
| 💡 Different segments need different strategies | ||||
Step 2: Increase Repeat Purchase Frequency
Don't spam. Nudge.
🔹 Precision Replenishment
If your product lasts 30 days, do not send a generic newsletter.
Trigger a WhatsApp nudge at Day 25–28.
🔹 Usage Education (The "Value" Add)
Selling skincare? Send:
- "How to layer properly"
- "Why purging happens"
- "When results appear"
Education reduces churn. If they use it right, they buy it again.
🔹 Post-Purchase Check-ins
- Day 3: "How is it feeling?"
- Day 10: "Common mistakes to avoid."
- Day 21: "Ready for Step 2?"
This builds product habit, reduces refunds, and increases second-order probability.
| THE 30-DAY HABIT-BUILDING SEQUENCE | |||
| Timeline | Channel | Action | Goal |
|---|---|---|---|
| DAY 0 Purchase |
Order confirmation + delivery timeline + product usage guide link | Set expectations and build excitement | |
| DAY 3 Delivered |
"How is it feeling?" check-in message | Reduce cognitive dissonance, ensure satisfaction | |
| DAY 10 Optimization |
"Common mistakes to avoid" + pro tips + tutorial video | Ensure proper usage, maximize product value | |
| DAY 21 Cross-sell |
"Ready for Step 2?" + complementary product + 10% discount | Category expansion, increase AOV | |
| DAY 25-28 Replenishment |
"Running low! Reorder now" precision timing nudge | Trigger second purchase, build habit | |
|
🎯 Expected Results: Without sequence: 20% repeat rate With sequence: 35-42% repeat rate Impact: +15-22 points = 75-110% LTV improvement |
|||
Step 3: Increase AOV with Contextual Cross-Selling
Random bundles don't work. Smart brands use predictive analytics and customer journey mapping.
❌ The Wrong Way:
Buying ads to sell a bundle to cold traffic.
✅ The Right Way:
- Customer buys Facewash.
- Wait 14 days (Let them experience value).
- Recommend Moisturizer as the "Next Step."
Even a 15% improvement in AOV can materially shift your unit economics.
Step 4: Reduce CAC Through Margin-Based Bidding
To reduce CAC in India, you must stop treating all clicks equally.
- ✅ Increase bids for High-CLTV cohorts (Lookalikes of your Whales)
- ✅ Exclude low-margin segments
- ✅ Stop retargeting customers who have a high RTO rate
Step 5: The Hidden Killer – RTO & Margin Leakage
In India, Return to Origin (RTO) destroys unit economics.
Smart strategies to reduce RTO:
- 🔹 Automated COD confirmation via WhatsApp
- 🔹 Address verification algorithms
- 🔹 Pre-dispatch engagement to build excitement
Lower RTO = Higher Margin = Better LTV:CAC
| HOW RTO DESTROYS YOUR CONTRIBUTION MARGIN | ||
| Scenario: 100 COD Orders at ₹1,200 AOV | ||
| Metric | Without RTO Reduction (20% RTO Rate) |
With RTO Reduction (12% RTO Rate) |
|---|---|---|
| Orders Placed | 100 | 100 |
| Failed Deliveries | 20 orders | 12 orders |
| Cost per RTO |
Forward + Reverse: ₹160 | Gateway: ₹24 | Restocking: ₹16 Total: ₹200 per RTO |
|
| Total RTO Loss | ₹4,000 | ₹2,400 |
| Successful Orders | 80 | 88 |
| Gross Contribution | ₹38,400 | ₹42,240 |
| Net Contribution | ₹34,400 | ₹39,840 |
| Per Order | ₹344 (down from ₹480) | ₹398 |
| Impact | ❌ 28% MARGIN EROSION | ✅ 16% IMPROVEMENT |
|
📈 Annual Impact (10,000 monthly orders): Margin improvement: ₹54 × 10,000 × 12 = ₹64,80,000 saved annually |
||
The System Most Brands Are Missing
Most brands struggle because their data is trapped in silos:
- Shopify data is separate
- Meta ads data is separate
- WhatsApp & Email are separate
There is no unified customer memory.
So segmentation remains manual.
Engagement remains generic.
💡 How do AI agents help increase retention in D2C brands?
AI agents increase retention by continuously analyzing unified customer behavior and triggering the right action at the right time.
Instead of static automation flows, AI agents dynamically segment customers, predict replenishment windows, identify churn risk, and personalize cross-sell recommendations in real time.
For example:
- ✅ Detecting when a customer's reorder cycle is slowing
- ✅ Triggering precision WhatsApp nudges instead of blanket discounts
- ✅ Increasing bids only for high-LTV cohorts
- ✅ Prioritizing support responses for high-value customers
By combining unified customer memory with autonomous decision-making, AI agents turn retention from manual campaigns into an always-on optimization system.
| MANUAL RETENTION vs. AI-POWERED RETENTION | ||
| Aspect | 📋 Manual Approach | 🤖 AI Agent Approach |
|---|---|---|
| Data Collection |
• Export from 5 platforms • Manually merge in Excel • Fix mismatched IDs ⏱️ 6-8 hours/week |
• Real-time unified data • Single customer view • Instant updates ⏱️ Automated |
| Segmentation |
• 3-5 static segments • "New, Active, Lapsed" • Manual weekly updates Segments: 3-5 |
• Dynamic per-customer • Real-time RFM analysis • Continuous updates Segments: Infinite (1:1) |
| Campaign Creation |
• Write 3 email templates • Everyone gets same message • Manual A/B testing ⏱️ 4-6 hours/campaign |
• AI generates personalized • Optimal timing per person • Continuous optimization ⏱️ Automated |
| Channel Execution |
• Separately in each tool • Context breaks • Timing conflicts 8-12% effectiveness |
• Unified across all channels • Seamless handoffs • Coordinated timing 35-42% effectiveness |
| Optimization |
• Monthly manual review • Implement changes slowly • Limited testing capacity +5% quarterly |
• Real-time learning • Instant adjustments • Unlimited parallel tests +2-3% weekly |
| Total Weekly Time | 15-20 hours | 2-3 hours (oversight only) |
| Repeat Rate Impact | 20% → 25% (slow progress) |
20% → 40% (6 months) |
The Bottom Line
If your LTV:CAC ratio is below 2:1, your growth will eventually stall.
For most D2C brands, a healthy LTV:CAC ratio should move toward 3:1 to enable sustainable scaling.
To scale profitably in 2026, D2C brands must:
- ✅ Increase repeat purchase rate
- ✅ Optimize contribution margin
- ✅ Automate post-purchase engagement
The brands that treat retention as a system — powered by intelligent, unified data — will outperform those chasing the next ad click.
The brands winning in 2026 won't run more tools.
They'll run unified systems.
Ready to Fix Your Unit Economics?
AgentCord is the autonomous layer that connects your Shopify, ads, and messaging data into one intelligent growth engine — designed to increase LTV and reduce CAC systematically.
Want to see how D2C brands are implementing this?
Let's talk.